Flexpro is a professional data analysis software that can most intuitively display and analyze data, and is often used for the analysis of signal data dynamic processes. FlexPro covers most of the common formulas required for signal processing. Through the use of formulas, we can solve most difficult data analysis tasks. The following will introduce the application and interface display of FlexPro formula.
Example 1: Processing the data in the area through the coordinate axis
In operation, we most often use the coordinate axis to calculate the value within the area. The functions include the average value, maximum value, minimum value, and root mean square of signal data.
Below, take a complete ultrasonic signal as an example:
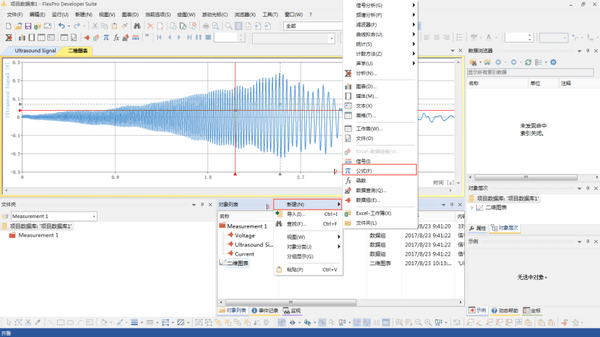
In FlexPro, the array exists on the main block diagram in the form of a table, and the example in the red frame below is shown in the form of a graph.
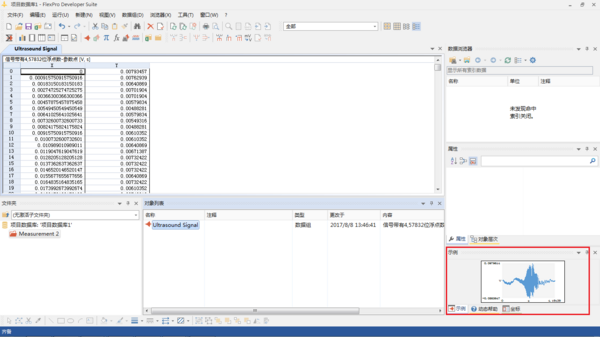
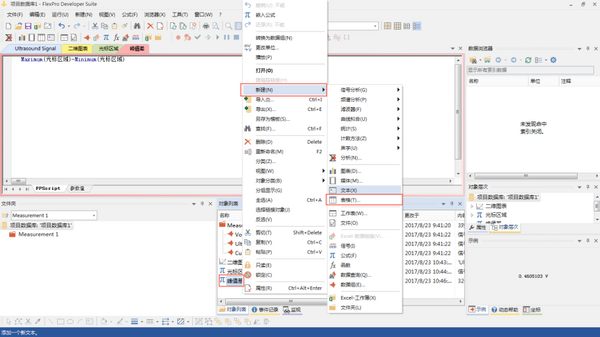
Create a two-dimensional chart of data by creating a new icon
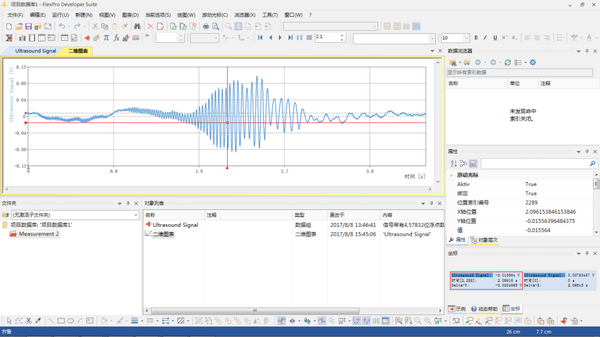
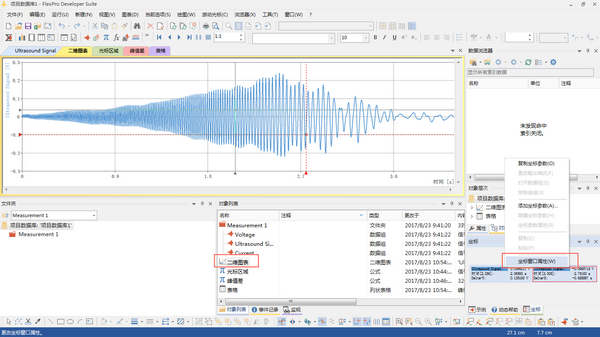
At this time, open the double cursor in the swimming cursor option
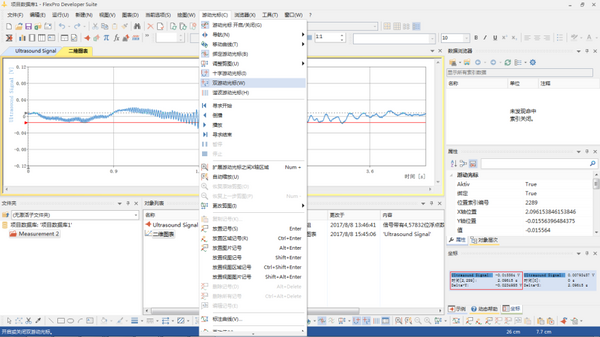
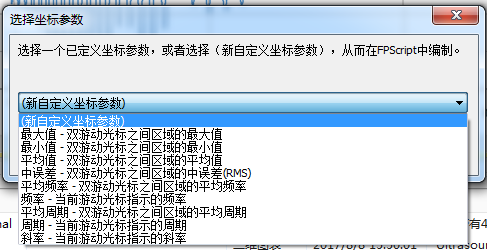
Open the coordinate bar in the lower right corner and add coordinate parameters
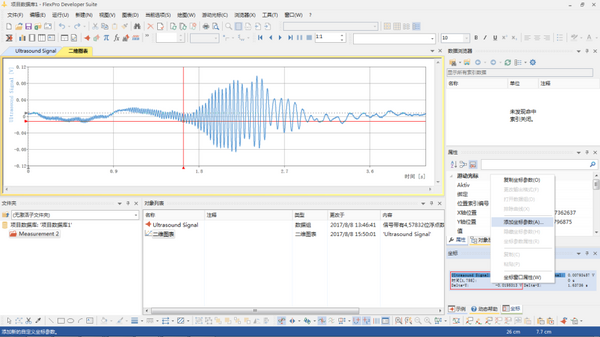
Relying on these modular formulas, we can get the maximum value, minimum value, average value and so on in the selected area. In addition to the specified function parameters, custom coordinate parameters can be added.
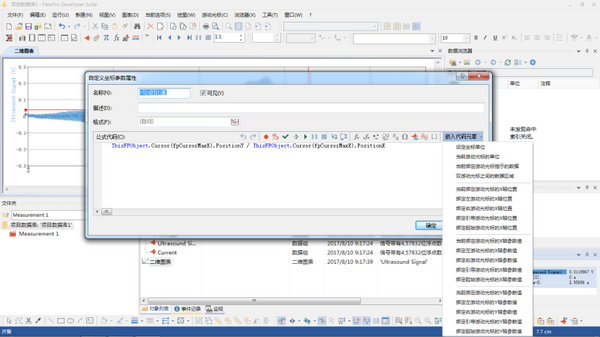
In this custom coordinate parameter attribute, you can directly refer to the X and Y axis positions and values ​​of the current coordinate axis for calculation. The advantages are faster, simpler, and convenient, and the formula is easy to switch between different curves.
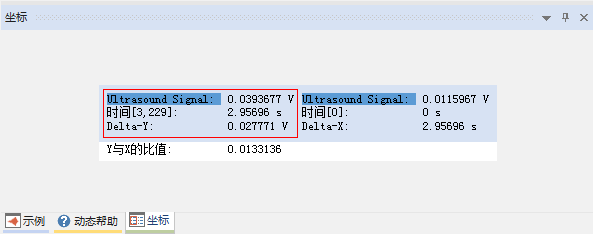
The newly added values ​​will be displayed directly in the "Coordinates" block diagram and change in real time with the coordinate axis.
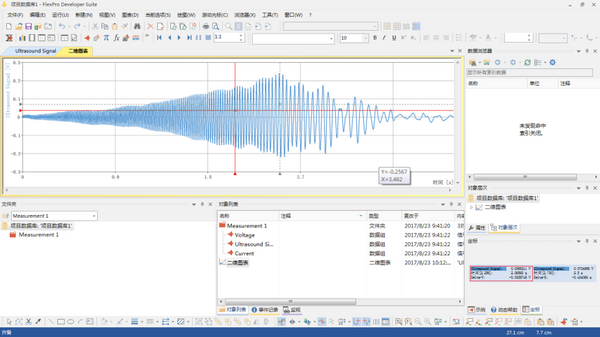
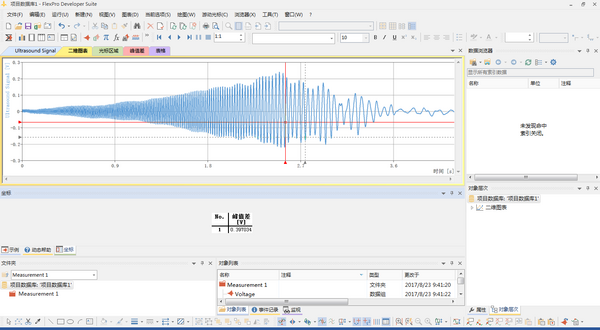
Example 2: Add formula to calculate the maximum peak difference in the signal area
Open a signal, add 2D graphics and hyperbola
Click the blank area of ​​the list area --- New --- Formula to add a formula
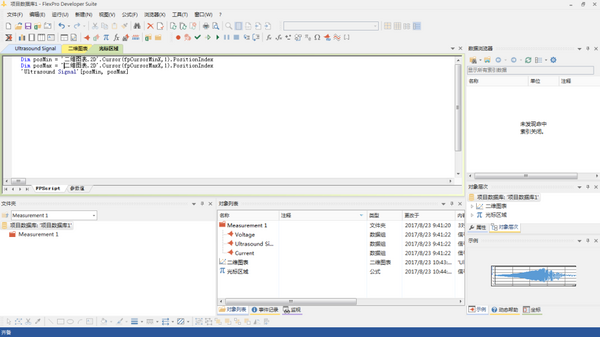
Name the announcement "Cursor Area"
Define the left and right cursors: 'two-dimensional chart. 2D'. Cursor (fpCursorMinX, 1). PositionIndex
'Two-dimensional chart. 2D'. Cursor (fpCursorMaxX, 1). Position Index
'Ultrasound Signal' [posMin, posMax] Select all parameters in the interval, Ultrasound Signal is the signal name
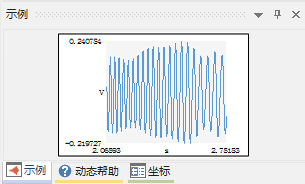
You can see the coordinate selected value in the "Example" preview box in the right column
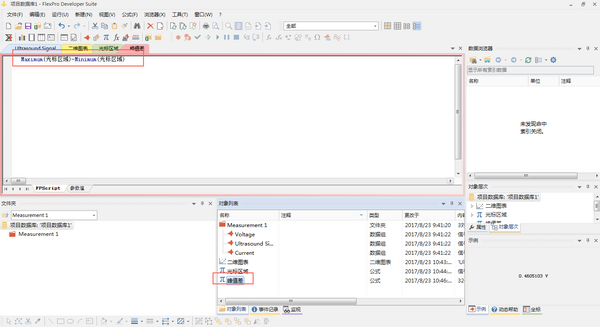
Create a new formula and name it "Peak Difference"
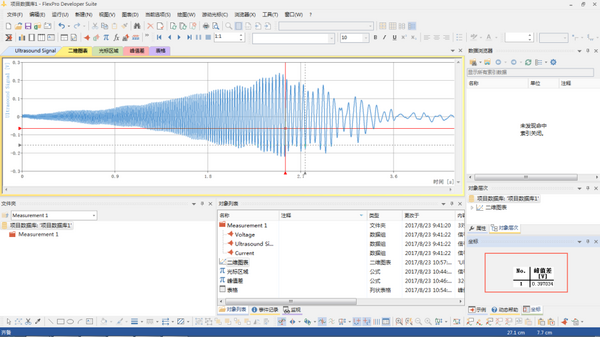
Formula: Maximum (cursor area)-Minimum (cursor area) in the right column, the value of the maximum peak difference in the area has been displayed
The calculation results are displayed on the graphical interface in real time, we also need to add a table
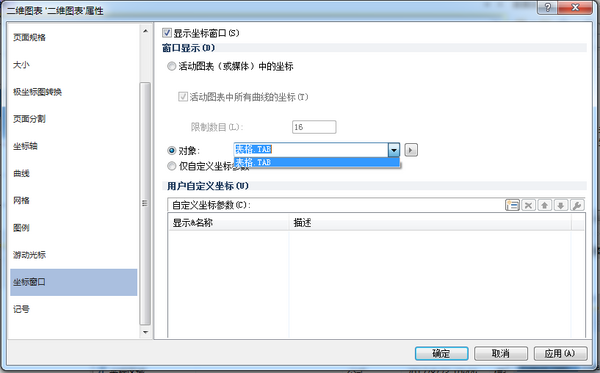
In the coordinate properties at the bottom right of the graphical interface, select "Coordinate Window Properties"
Select the created table in the object to replace the original default parameters
At this point, the calculation result has clearly appeared in the lower right coordinate bar
You can change the position at will by dragging. You can change the size of the table and the number of parameters by setting the table properties.
AMERICA DIVISION OF TOP SHINE CO.,LTD. , https://www.fiestasupplier.com